
Updated November 2026. By MeltValue.com.
Silver more than tripled in a little over a year, set a record in January 2026, and then lost more than half of that peak by November. Through all of it, the world kept using more silver than it mined and recycled.
This page collects 116 silver statistics on how much silver exists, where it comes from, the supply gap, what it has cost and who buys it. Each figure comes from the organization that produced it, such as the U.S. Geological Survey, the Silver Institute and the World Bank, and each carries a link and a date.
We run live melt value calculators at MeltValue.com, so the last section adds figures from our own open dataset of coin values back to 1960. Those are labeled as ours.
What silver is worth right now
Shown at September 2026's average price of $64.60 an ounce. With JavaScript on, these update to the live spot price.
- Silver spot price, per troy ounce
- $64.60
- One 90% silver quarter (0.1808 oz of silver)
- $11.68
- One Morgan or Peace dollar (0.7734 oz of silver)
- $49.96
- One troy ounce of sterling silver (92.5%)
- $59.76
Our arithmetic. Silver content from the MeltValue coin dataset, price from the MeltValue live feed.
Top silver statistics
- Silver hit a record high of US$121.65 an ounce in late January 2026 (Silver Institute, Nov 2026).
- Silver averaged $39.80 an ounce in 2025, up from $5 in 2000 (World Bank, Sep 2026).
- The silver market is forecast to run its sixth straight annual deficit in 2026, with demand ahead of supply by 35 million ounces (Silver Institute, Nov 2026).
- About 1,740,000 metric tons of silver have been discovered to date, enough to fill a cube 55 meters on a side (USGS, Nov 2024).
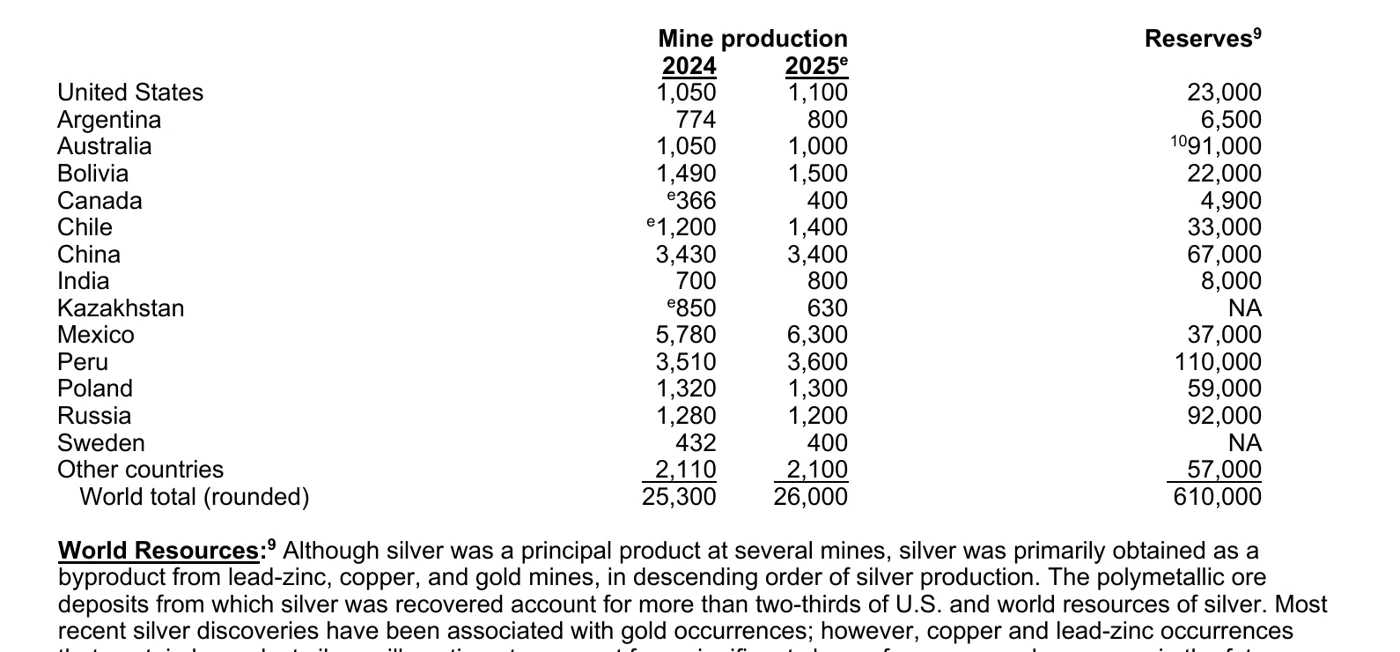
- Mexico is the largest silver producer, with an estimated 6,300 tonnes in 2025 (USGS, Feb 2026).
- Peru holds the largest silver reserves of any country, at 110,000 tonnes (USGS, Feb 2026).
- Industry used 657 million ounces of silver in 2025, more than half of all demand (Silver Institute, Nov 2026).
- Solar panels took 29% of industrial silver demand in 2024, up from 11% in 2014 (Silver Institute, Dec 2025).
- The United States relied on imports for 77% of the silver it consumed in 2025 (USGS, Feb 2026).
- Silver joined the U.S. list of critical minerals on November 7, 2025 (USGS, Feb 2026).
- The gold to silver ratio fell to 43 in January 2026, its lowest level since 2011 (Silver Institute, Nov 2026).
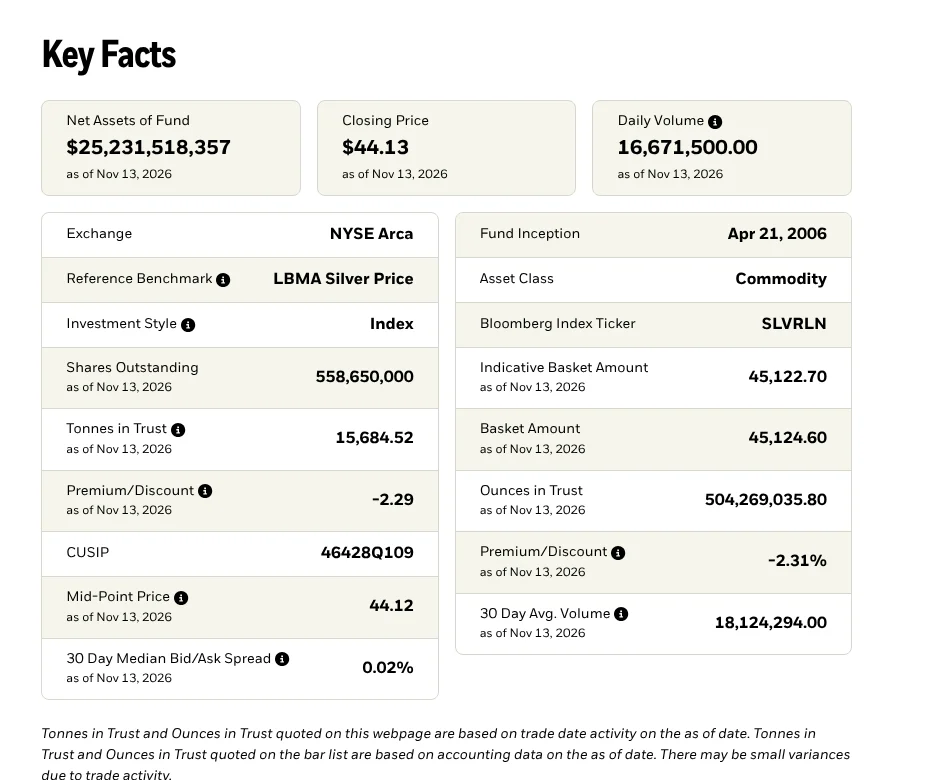
- The largest silver fund, the iShares Silver Trust, held 504,269,036 ounces on November 13, 2026 (iShares, Nov 2026).
- The Coinage Act of 1965 took silver out of U.S. dimes and quarters (U.S. Congress, Jul 1965).
- The silver in a pre-1965 quarter was worth $11.68 in September 2026, about 47 times face value (MeltValue.com, Oct 2026).
How much silver is in the world?
Silver is far more plentiful than gold, and most of it comes out of the ground by accident. The mines that produce it are usually digging for lead, zinc, copper or gold.
How much silver has been found?
Just four countries hold 55% of all the silver discovered so far (USGS, Nov 2024).
- World silver reserves stand at 610,000 tonnes (USGS, Feb 2026).
- Russia, with 92,000 tonnes, and Australia, with 91,000 tonnes, rank behind Peru (USGS, Feb 2026).
- China has 67,000 tonnes of reserves and Poland 59,000 tonnes (USGS, Feb 2026).
- U.S. reserves are 23,000 tonnes (USGS, Feb 2026).
- People first mined silver around 3,000 BCE in Anatolia, in what is now Turkey (Silver Institute, Nov 2026).
- Between 1500 and 1800, Bolivia, Peru and Mexico accounted for over 85% of world silver production and trade (Silver Institute, Nov 2026).
Which countries produce the most silver?
World mines produced an estimated 26,000 tonnes of silver in 2025, up from 25,300 tonnes in 2024 (USGS, Feb 2026).
- Peru produced an estimated 3,600 tonnes and China 3,400 tonnes (USGS, Feb 2026).
- Bolivia, Chile and Poland followed, at 1,500, 1,400 and 1,300 tonnes (USGS, Feb 2026).
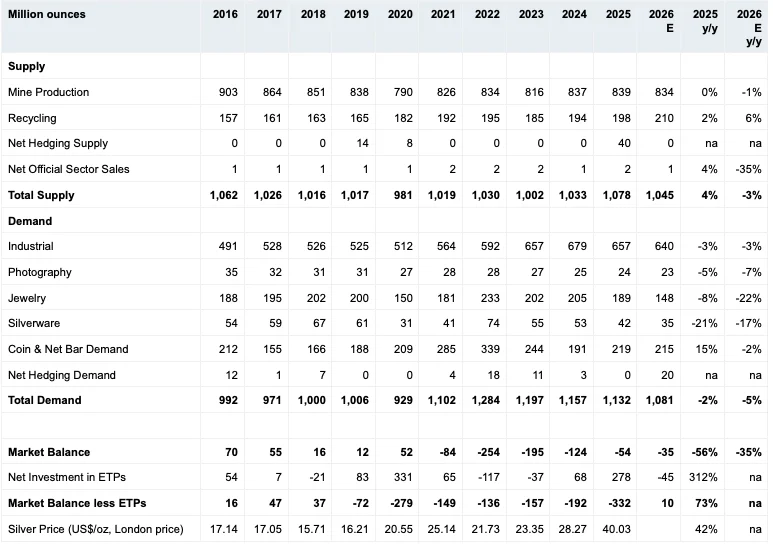
- The Silver Institute counts 839 million ounces of mine production in 2025 and forecasts 834 million ounces in 2026 (Silver Institute, Nov 2026).
- North American output fell 3% in 2025 to its lowest level in 10 years, while Central and South American output rose 5% (Silver Institute, Apr 2026).
How much silver does the United States produce?
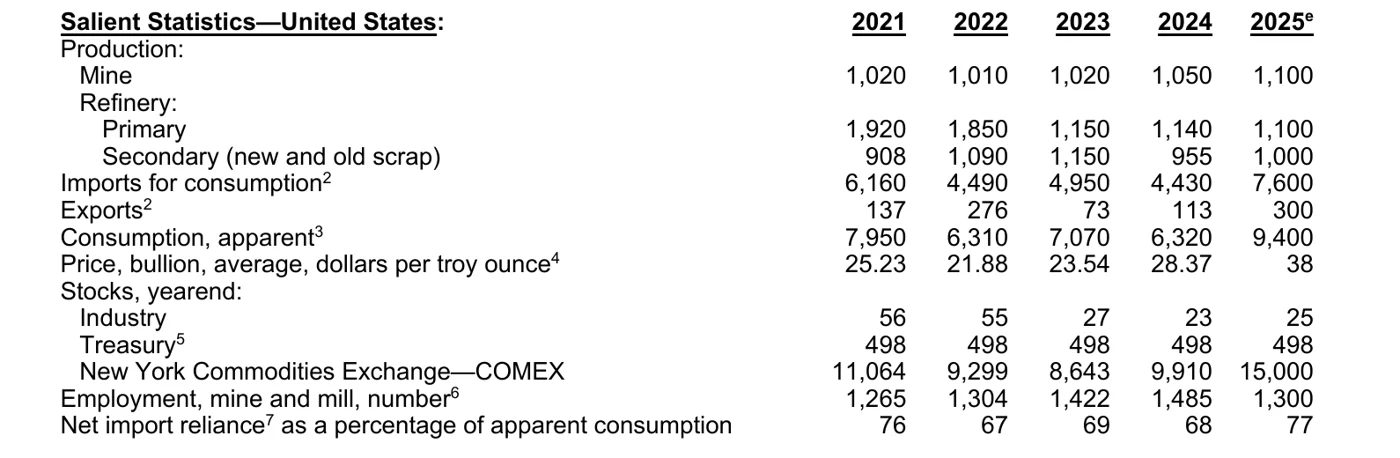
U.S. mines produced about 1,100 tonnes of silver in 2025, worth an estimated $1.4 billion (USGS, Feb 2026).
- The silver came from 4 silver mines and 31 base-metal and precious-metal operations where it was a byproduct or coproduct (USGS, Feb 2026).
- Alaska was the leading silver state, followed by Nevada (USGS, Feb 2026).
- 24 U.S. refiners turned out an estimated 2,100 tonnes of commercial-grade silver (USGS, Feb 2026).
- U.S. mine output was 1,150 tonnes in 2016 (USGS, Jan 2021).
- U.S. silver mines and mills employed about 1,300 people in 2025 (USGS, Feb 2026).
- Mexico supplied 47% of U.S. silver imports from 2021 through 2024, and Canada supplied 18% (USGS, Feb 2026).
Is silver mostly a byproduct?
Yes. Most silver comes from lead-zinc, copper and gold mines, in that order (USGS, Feb 2026).
- Polymetallic ore deposits account for more than two-thirds of U.S. and world silver resources (USGS, Feb 2026).
- In 2025 silver output from gold operations rose 5% and output from copper operations rose 6% (Silver Institute, Apr 2026).
How much silver is recycled?
Recycling supplied 198 million ounces in 2025 and is forecast to rise 6% to 210 million ounces in 2026 (Silver Institute, Nov 2026).
- The 2025 total was a 12-year high, even though refinery bottlenecks capped volumes (Silver Institute, Apr 2026).
- The United States recovered about 1,000 tonnes from scrap in 2025, equal to about 11% of its apparent consumption (USGS, Feb 2026).
Is there a silver shortage?
By the industry's own ledger, the world has used more silver than it produced in every year since 2021. The gap is real, but it peaked in 2022 and has narrowed each year since.
How big is the silver deficit?
Demand outran supply by 54 million ounces in 2025 (Silver Institute, Nov 2026).
- The largest deficit in the series was 254 million ounces in 2022 (Silver Institute, Nov 2026).
- The gap was 195 million ounces in 2023 and 124 million ounces in 2024 (Silver Institute, Nov 2026).
- Total supply was 1,078 million ounces in 2025 against total demand of 1,132 million ounces (Silver Institute, Nov 2026).
- For 2026 the forecast is 1,045 million ounces of supply and 1,081 million ounces of demand (Silver Institute, Nov 2026).
- In April the Institute had expected a wider 2026 deficit of 46.3 million ounces (Silver Institute, Apr 2026).
- The last surplus, 52 million ounces, came in 2020 (Silver Institute, Nov 2026).
How much silver is in stockpiles?
COMEX warehouses held about 15,000 tonnes of silver at the end of 2025, up from 9,910 tonnes a year earlier (USGS, Feb 2026).
- The U.S. Treasury's silver stock has been 498 tonnes at every year-end from 2021 through 2025 (USGS, Feb 2026).
- Exchange-traded products worldwide held 1.25 billion ounces on November 3, 2026, down 55 million ounces since the start of the year (Silver Institute, Nov 2026).
- Falling inventories and a shift of metal into CME vaults produced a liquidity squeeze in October 2025 (Silver Institute, Apr 2026).
Does the US depend on imported silver?
Heavily. Apparent U.S. consumption jumped to 9,400 tonnes in 2025 from 6,320 tonnes in 2024 (USGS, Feb 2026).
- The United States imported 7,600 tonnes of silver for consumption in 2025 and exported 300 tonnes (USGS, Feb 2026).
What is silver used for?
Silver is an industrial metal first. Factories take more than half of it, and jewelry buyers are the ones who back away when the price jumps.
Which industries use the most silver?
In the United States, electrical and electronics uses took 25% of silver in 2025, other industrial uses and photography 19%, investment bars 18%, solar panels 15%, coins and medals 14%, jewelry and silverware 6%, and brazing and solder 3% (USGS, Feb 2026).
- World silver consumption was an estimated 35,700 tonnes in 2025, against 36,100 tonnes in 2024 (USGS, Feb 2026).
- Industrial demand is forecast at 640 million ounces in 2026, about 22% above its 2019 level (Silver Institute, Nov 2026).
- Outside solar, industrial demand is forecast to rise 4.5% to 492 million ounces in 2026 (Silver Institute, Nov 2026).
- Photography used 24 million ounces in 2025, down from 35 million ounces in 2016 (Silver Institute, Nov 2026).
How much silver goes into solar panels and electric cars?
Solar demand is now falling, because record prices have pushed panel makers to use less silver in each cell (Silver Institute, Nov 2026).
- Electric vehicles use 67% to 79% more silver than combustion-engine vehicles, or about 25 to 50 grams each (Silver Institute, Dec 2025).
- Automotive silver demand is forecast to grow 3.4% a year between 2025 and 2031 (Silver Institute, Dec 2025).
- Electric vehicles are forecast to make up 59% of automotive silver demand by 2031 (Silver Institute, Dec 2025).
- Global IT power capacity grew from 0.93 gigawatts in 2000 to nearly 50 gigawatts in 2025, a proxy for the computing hardware that uses silver (Silver Institute, Dec 2025).
How much silver jewelry is sold?
Jewelry fabrication used 189 million ounces of silver in 2025, down 8% (Silver Institute, Nov 2026).
- Jewelry demand is forecast to fall 22% to 148 million ounces in 2026 (Silver Institute, Nov 2026).
- Silverware used 42 million ounces in 2025 and is forecast at 35 million ounces in 2026 (Silver Institute, Nov 2026).
- Indian jewelry fabrication fell 20% in 2025 as rupee prices hit records (Silver Institute, Apr 2026).
What is the highest silver price ever?
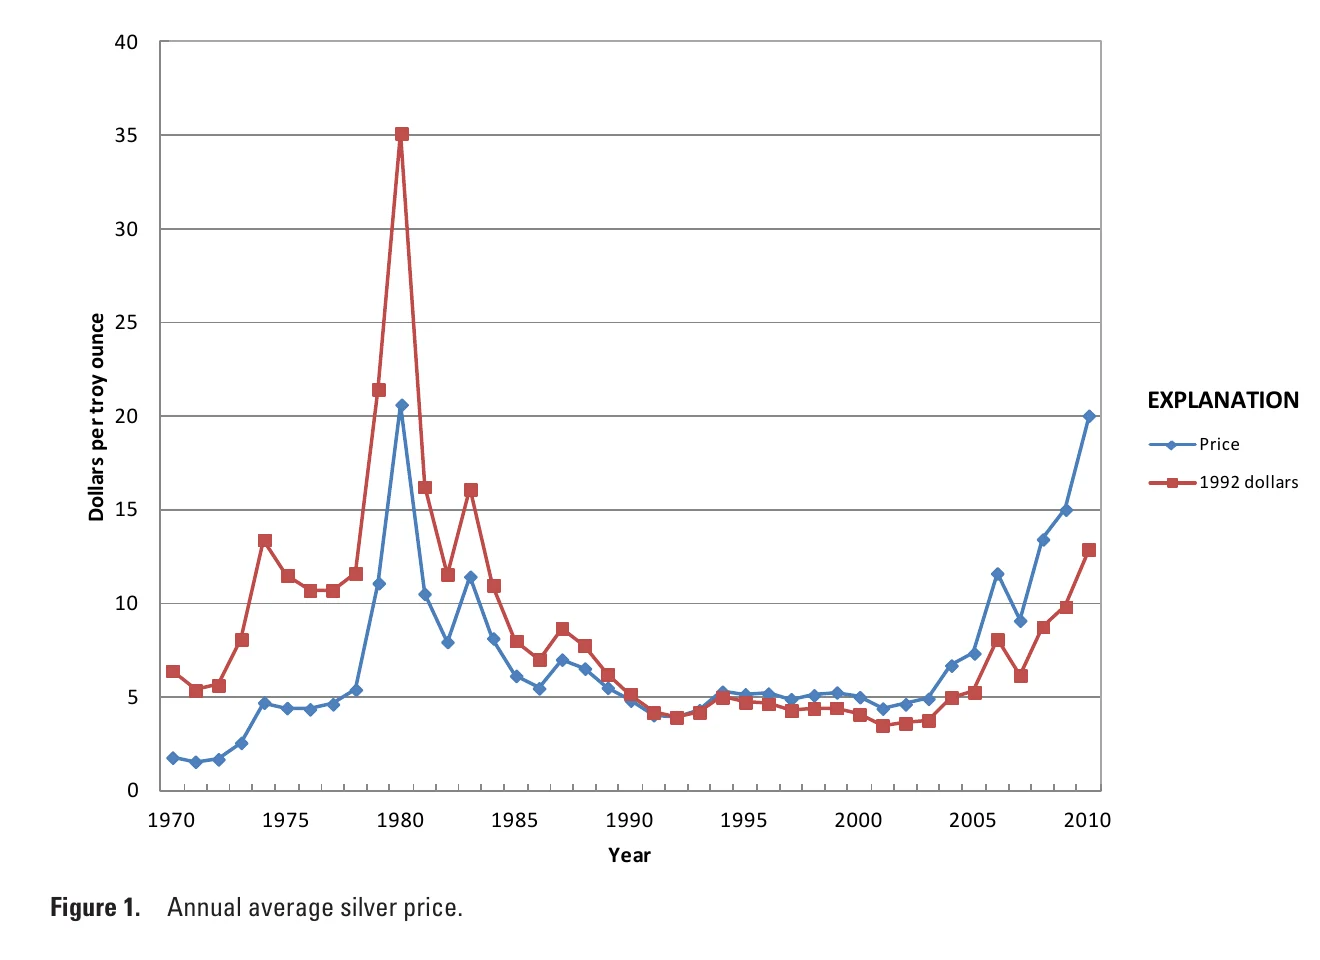
Silver's price history has two famous spikes, 1980 and 2011, and a third that dwarfs both. The January 2026 monthly average was more than double the January 1980 one.
What was silver's all-time high?
The record came in late January 2026. By November 4 the price was back to $52 an ounce, down 27% since the start of the year (Silver Institute, Nov 2026).
- The highest monthly average on record is $92.10 an ounce, set in January 2026 (MeltValue.com, Oct 2026).
- The London silver price averaged $40.03 in 2025, up 42% (Silver Institute, Nov 2026).
- 2025 was silver's strongest year since 1979, and in January 2026 the price passed $100 for the first time (Silver Institute, Feb 2026).
- Silver began 2025 at $29.35, its low for the year, and reached $53.60 on November 13, 2025 (USGS, Feb 2026).
What was the price of silver in 1980?
Silver averaged $20.63 an ounce in 1980, between $11.09 in 1979 and $10.52 in 1981 (USGS, Mar 2013).
- The monthly average peaked at $38.90 in January 1980 (MeltValue.com, Oct 2026).
- USGS lists 1979 to 1980 as the period when individual investors tried to corner the silver market (USGS, Mar 2013).
- Two buyers and their associates took delivery of millions of ounces when their futures contracts matured (USGS, Mar 2013).
- No later year beat the 1980 average until 2011, when silver averaged $35.20 (World Bank, Sep 2026).
What has silver cost by year?
Annual averages show how long silver stayed cheap.
- Silver averaged $1.80 an ounce in 1970 and $4.80 in 1990 (World Bank, Sep 2026).
- It averaged $20.50 in 2020 and $28.30 in 2024 (World Bank, Sep 2026).
- Going further back, silver averaged $0.62 in 1900 and fell to $0.28 in 1932 (USGS, Mar 2013).
What did silver cost 10 years ago?
Silver averaged $17.10 an ounce in 2016 (World Bank, Sep 2026).
- USGS, which uses a different price series, recorded a 2016 average of $17.20 (USGS, Jan 2021).
- The monthly average rose from $19.40 in September 2016 to $64.60 in September 2026 (MeltValue.com, Oct 2026).
What is the gold to silver ratio?
It is the number of ounces of silver one ounce of gold buys. After the January low it returned to the high 70s by early November 2026 (Silver Institute, Nov 2026).
- A study of prices from January 1970 to May 2026 found a long-run equilibrium of just under 60 to 1 (Silver Institute, Jul 2026).
- On monthly averages the ratio peaked at 111 in April 2020 and bottomed at 17 in January 1980 (MeltValue.com, Oct 2026).
Who buys silver as an investment?
Small investors are the swing buyers in silver. They bought heavily during the rally and stepped back once prices fell.
How much silver do investors buy in bars and coins?
Coin and bar demand rose 15% to 219 million ounces in 2025 (Silver Institute, Nov 2026).
- The 2026 forecast is 215 million ounces, down 2% but still about 13% above 2024 (Silver Institute, Nov 2026).
- U.S. retail silver investment is expected to hit its lowest level since 2010 in 2026 (Silver Institute, Nov 2026).
- Indian coin and bar demand rose 33% in 2025, while U.S. demand fell for a third straight year (Silver Institute, Apr 2026).
How much silver do funds hold?
The iShares Silver Trust held 15,684.52 tonnes and had net assets of $25.23 billion on November 13, 2026 (iShares, Nov 2026).
- The fund launched on April 21, 2006 (iShares, Nov 2026).
- Silver averaged its highest price since 1983 in 2006, which USGS attributes to interest in the new exchange-traded fund (USGS, Mar 2013).
- Exchange-traded products added 278 million ounces in 2025 and are forecast to shed 45 million ounces in 2026 (Silver Institute, Nov 2026).
How many silver coins does the US Mint sell?
Silver coin products brought the Mint $192.6 million in fiscal 2025, or 39.3% of its numismatic revenue (U.S. Mint, Apr 2026).
- The 2025 Silver Proof Eagle and the 2025 Proof Set sold a combined 534,000 units (U.S. Mint, Apr 2026).
- The Mint sold 2.9 million numismatic units against a target of 3.4 million, and it blames the rising silver price (U.S. Mint, Apr 2026).
- In January 2026 the Mint arranged a line of credit of up to $4.5 billion with the Treasury to manage its silver hedge program (U.S. Mint, Apr 2026).
- The Mint was authorized to begin striking a silver bullion coin in 1985 (USGS, Mar 2013).
- By law the American Silver Eagle is 40.6 millimeters across, weighs 31.103 grams and contains .999 fine silver (U.S. Code, Nov 2026).
What are silver coins worth melted?
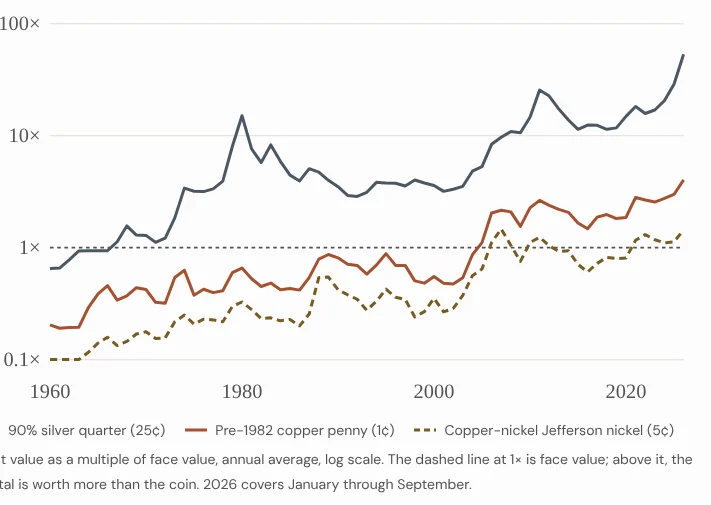
U.S. dimes, quarters and half dollars dated 1964 or earlier are 90% silver, and the metal in them has been worth more than face value for over fifty years.
What is junk silver worth?
At September 2026 prices a 90% silver dime held $4.67 of silver and a 90% half dollar held $23.37 (MeltValue.com, Oct 2026).
- A Morgan or Peace dollar, with 0.7734 ounces of silver, held $49.96 (MeltValue.com, Oct 2026).
- At the January 2026 peak a 90% quarter held $16.65 of silver, about 67 times face value (MeltValue.com, Oct 2026).
- In January 2000 the silver in the same quarter was worth 94 cents (MeltValue.com, Oct 2026).
- The melt value of 90% coins first passed face value in July 1967 (MeltValue.com, Oct 2026).
When did US coins stop being silver?
The 1965 act replaced silver dimes and quarters with coins clad in 75% copper and 25% nickel over a copper center (U.S. Congress, Jul 1965).
- The half dollar kept some silver: 4.6 grams in an 11.5-gram coin, or 40% (U.S. Congress, Jul 1965).
- Coins struck from 900 fine silver after the act still carried the date 1964 (U.S. Congress, Jul 1965).
- Silver coins were withdrawn from circulation in 1967, and silver certificates could be redeemed for metal until June 24, 1968 (USGS, Mar 2013).
- Once the market price rose above $1.38 an ounce, melting circulating U.S. coins for their silver turned a profit (USGS, Mar 2013).
What are 40% silver coins and war nickels worth?
A 1965 to 1970 Kennedy half dollar held $9.55 of silver in September 2026, about 19 times face value (MeltValue.com, Oct 2026).
- A 40% silver Eisenhower dollar held $20.41 (MeltValue.com, Oct 2026).
- A wartime Jefferson nickel, which is 35% silver, held $3.64, about 73 times face value (MeltValue.com, Oct 2026).
- The war nickel's metal has been worth more than five cents every month since December 1961 (MeltValue.com, Oct 2026).
What do sterling and coin silver mean?
- Under the FTC's Jewelry Guides, "sterling" may only describe metal that is at least 925 parts per thousand pure silver, and "coin silver" at least 900 parts (Federal Trade Commission, Nov 2026).
- The word "silver" alone needs a fineness mark in front of it, such as "750 silver" (Federal Trade Commission, Nov 2026).
How is selling silver taxed?
- The IRS taxes net capital gains from selling collectibles, a category that includes coins, at a maximum rate of 28% (IRS, Nov 2026).
To price your own coins and scrap at today's spot price, use the silver calculator or the US silver coin melt values table. Melt value counts metal only. A dealer's offer is usually lower.
Glossary
- Troy ounce: the unit silver trades in. One troy ounce is 31.1035 grams.
- Tonne: a metric ton, or 1,000 kilograms. One tonne is 32,150.7 troy ounces.
- Moz: million troy ounces.
- Market deficit: a year in which total demand is larger than total supply.
- Junk silver: circulated U.S. coins bought for their silver content, mostly 90% dimes, quarters and half dollars from 1964 and earlier.
- Sterling: an alloy that is 92.5% silver.
- ETP: exchange-traded product. A silver-backed ETP holds bullion on behalf of its shareholders.
- COMEX: the New York commodities exchange where silver futures trade.
- Melt value: what the metal in an item is worth at the market price, before any dealer margin.
Methodology and Sources
We used figures only from the body that produced them: the U.S. Geological Survey, the Silver Institute, the World Bank, the U.S. Mint, Congress and the fund that holds the metal. We read each source page or file in November 2026 and checked every number against it. The Silver Institute revised its 2025 figures between its April survey and its November update. Where the two differ we use November, and we cite April only for details the later release does not repeat. The Institute's two releases also date the January price record differently, on the 26th and the 29th, so we say late January. USGS and the Silver Institute count mine production differently and we name each. Pages with no printed date (U.S. Code, FTC guides, iShares, the Institute's history page) carry the month we read them. MeltValue.com figures come from our open dataset, which is built from World Bank monthly average prices. We refresh this page monthly.
Sources
- Silver Institute, Silver Market Set for Sixth Consecutive Annual Deficit in 2026
- Silver Institute, World Silver Survey 2026 release
- Silver Institute, Silver Demand Forecast to Expand Across Technology Sectors
- Silver Institute, Gold:Silver Ratio Continues to Be Relevant in the Modern Era
- Silver Institute, Global Silver Investment to Remain Strong in 2026
- Silver Institute, Silver Supply and Demand
- U.S. Geological Survey, Mineral Commodity Summaries 2026: Silver
- U.S. Geological Survey, Mineral Commodity Summaries 2021: Silver
- U.S. Geological Survey, Metal Prices in the United States Through 2010
- U.S. Geological Survey, How much silver has been found in the world?
- World Bank, Commodity Price Data (The Pink Sheet)
- MeltValue.com, US Coin Melt Value History, 1960 to 2026
- U.S. Congress, Coinage Act of 1965, Public Law 89-81
- U.S. Code, 31 U.S.C. 5112
- Federal Trade Commission, Jewelry Guides, 16 CFR 23.5
- iShares, iShares Silver Trust
- U.S. Mint, FY 2027 Congressional Budget Justification
- IRS, Topic no. 409, Capital gains and losses