
Updated November 2026. By MeltValue.com.
Gold set a record price in January 2026. Since then jewelry buyers have pulled back, central banks have kept buying, and mines have turned out about as much metal as they did the year before.
This page collects 125 gold statistics on how much gold exists, who mines it, who holds it, what it has cost and who buys it. Each figure comes from the organization that produced it, such as the U.S. Geological Survey, the Treasury, the World Gold Council and the World Bank, and each carries a link and a date.
We run live melt value calculators at MeltValue.com, so the last section adds figures from our own open dataset of coin and karat values back to 1960. Those are labeled as ours.
What gold is worth right now
Shown at September 2026's average price of $4,319 an ounce. With JavaScript on, these update to the live spot price.
- Gold spot price, per troy ounce
- $4,319
- All the gold above ground (224,200 tonnes)
- $31.1 trillion
- The U.S. government's gold (261.5 million ounces)
- $1.13 trillion
- One gram of 14K gold, melt value
- $81.00
Our arithmetic. Tonnage from the World Gold Council, ounces from the U.S. Treasury, price from the MeltValue live feed.
Top gold statistics
- The world's above-ground gold stock stood at about 224,200 tonnes at the end of the third quarter of 2026, worth US$30.0 trillion (World Gold Council, Nov 2026).
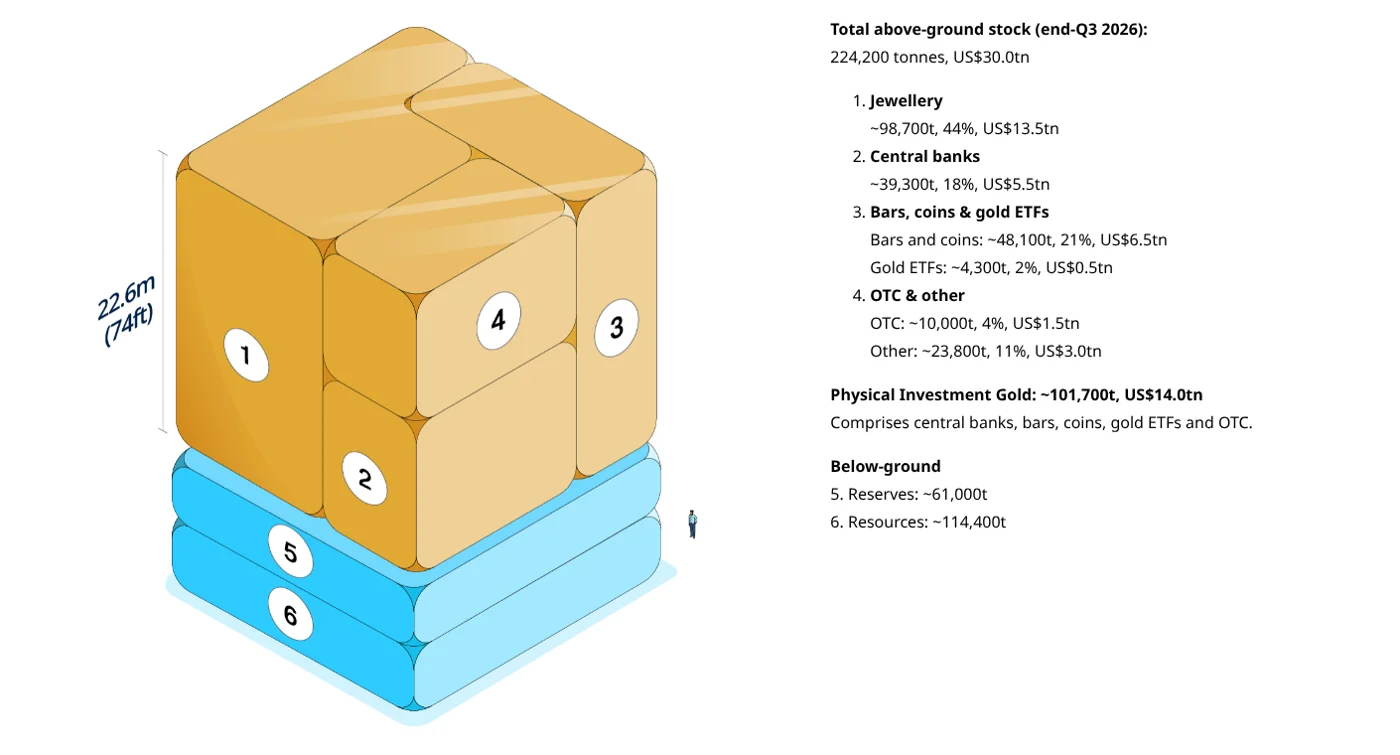
- All of that gold would fit in a cube about 22.6 meters (74 feet) on each side (World Gold Council, Nov 2026).
- Gold reached a historical high of US$5,405 an ounce in January 2026 (World Gold Council, Apr 2026).
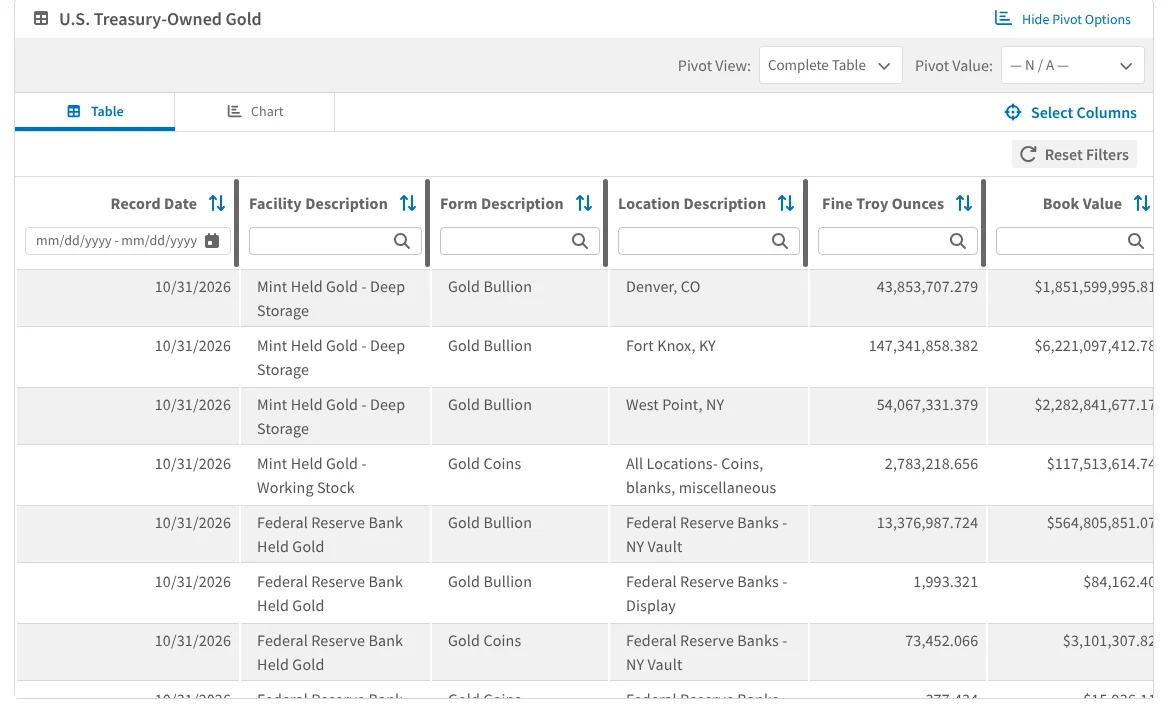
- The U.S. government owns 261,498,926 fine troy ounces of gold (U.S. Treasury, Oct 2026).
- Fort Knox holds 147,341,858 of those ounces, more than half of the total (U.S. Treasury, Oct 2026).
- The Treasury has carried that gold on its books at $42.2222 an ounce since 1973 (Federal Reserve Board, Nov 2024).
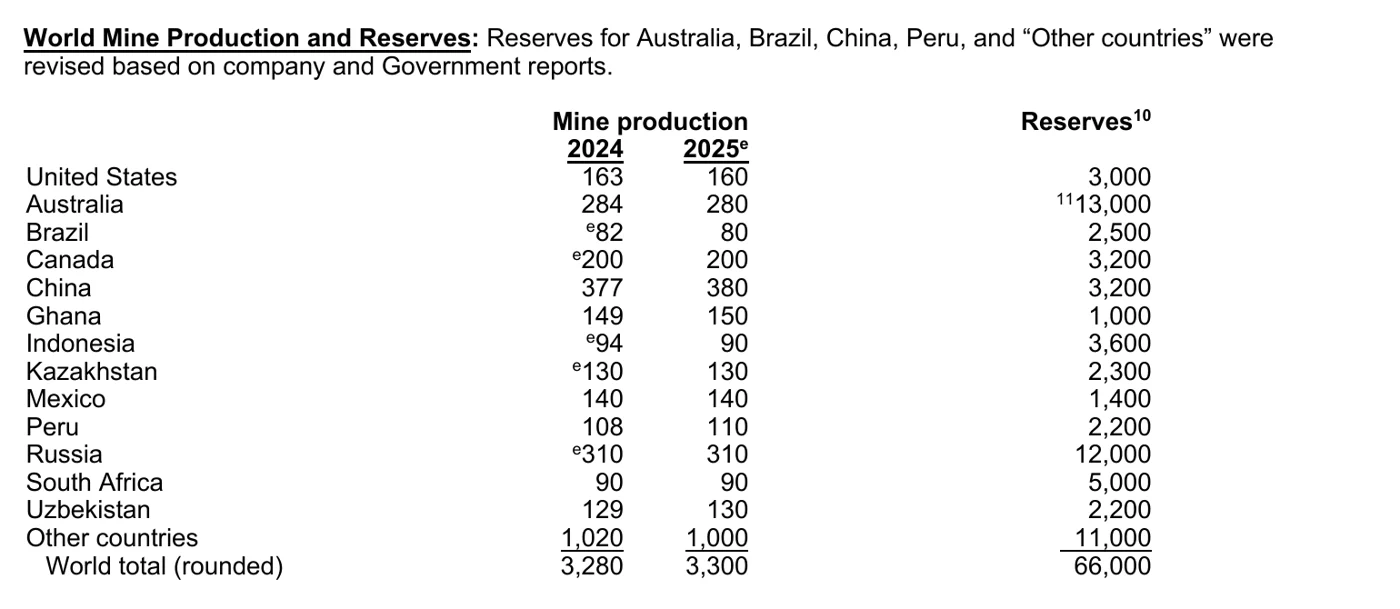
- World mines produced an estimated 3,300 tonnes of gold in 2025, and China led every country with 380 tonnes (USGS, Feb 2026).
- Total gold demand passed 5,000 tonnes for the first time in 2025, at a record value of US$555 billion (World Gold Council, Jan 2026).
- Central banks bought 863 tonnes of gold in 2025 (World Gold Council, Jan 2026).
- Jewelry buyers took 313 tonnes in the third quarter of 2026, the weakest third quarter in a data series that starts in 2000 (World Gold Council, Nov 2026).
- U.S. Mint bullion sales fell to nearly 15 million ounces in fiscal 2025 from 26.9 million ounces the year before (U.S. Mint, Apr 2026).
- The New York Fed's vault held about 507,000 gold bars weighing 6,331 metric tons as of 2024 (Federal Reserve Bank of New York, Nov 2026).
- Gold averaged $3,442 an ounce in 2025, up from $279 in 2000 (World Bank, Sep 2026).
- A gram of 14K gold averaged $81.00 in melt value in September 2026, up from $24.89 in September 2016 (MeltValue.com, Oct 2026).
How much gold is in the world?
Less than you would guess. Gold does not corrode and almost nobody throws it away, so nearly everything ever mined is still in a vault, a jewelry box or a circuit board.
How much gold has been mined?
Around two-thirds of all the gold ever mined has come out of the ground since 1950 (World Gold Council, Nov 2026). Here is where it sits today.
- Jewelry accounts for about 98,700 tonnes, or 44% of the stock (World Gold Council, Nov 2026).
- Bars and coins account for about 48,100 tonnes, or 21% (World Gold Council, Nov 2026).
- Central banks hold about 39,300 tonnes, or 18% (World Gold Council, Nov 2026).
- Gold-backed exchange-traded funds hold about 4,300 tonnes, or 2% (World Gold Council, Nov 2026).
How much gold is left to mine?
Published estimates of mineable reserves range from about 55,000 to 66,000 tonnes, depending on who is counting.
- The U.S. Geological Survey puts world gold reserves at 66,000 tonnes (USGS, Feb 2026).
- Australia, at 13,000 tonnes, and Russia, at 12,000 tonnes, have the largest reserves of any country (USGS, Feb 2026).
- U.S. reserves are 3,000 tonnes (USGS, Feb 2026).
- A USGS assessment of U.S. gold resources found 33,000 tonnes, with 15,000 identified and 18,000 undiscovered (USGS, Feb 2026).
- Metals Focus estimated 54,770 tonnes of reserves at the end of 2025 (World Gold Council, Mar 2026).
- The World Gold Council's own table lists about 61,000 tonnes of reserves and 114,400 tonnes of resources (World Gold Council, Nov 2026).
- Reserve estimates have stayed stable for decades even as mining continues, because higher prices and new drilling move resources into the reserve column (World Gold Council, Mar 2026).
Is there gold in the ocean?
Yes, but far too little per ton of water to recover.
- Seawater holds about one gram of gold for every 100 million metric tons of water, and there is no cost-effective way to extract it (NOAA, Sep 2026).
Where does gold come from?
Gold mining is spread thinner than most people assume. No country produces much more than a tenth of the world's supply, and the largest single mine barely registers against the total.
Which countries produce the most gold?
China, Russia, Australia, Canada and the United States lead, in that order, and together they produced 41% of the world's gold in 2025 (USGS, Feb 2026).
- Russia produced an estimated 310 tonnes and Australia 280 tonnes in 2025 (USGS, Feb 2026).
- Canada produced an estimated 200 tonnes (USGS, Feb 2026).
- Ghana, at 150 tonnes, and Mexico, at 140 tonnes, rank next among the countries USGS lists (USGS, Feb 2026).
- China accounted for around 10% of global mine production in 2025 (World Gold Council, Jun 2026).
- The World Gold Council, using Metals Focus data, put 2025 mine production higher, at a record 3,672 tonnes (World Gold Council, Jan 2026).
- Mines produced 1,071 tonnes in the third quarter of 2026, a record for a third quarter (World Gold Council, Nov 2026).
- The ten largest gold mining companies accounted for 27% of global production (World Gold Council, Mar 2026).
- Artisanal and small-scale mining supplied around 20% of the world's gold in 2024 (World Gold Council, Mar 2026).
- The world's largest gold mine in 2024, Muruntau in Uzbekistan, produced 65 tonnes (World Gold Council, Mar 2026).
How much gold does the United States produce?
The United States mined an estimated 160 tonnes of gold in 2025, worth about $17 billion (USGS, Feb 2026).
- Nevada produced about 64% of U.S. gold and Alaska about 22% (USGS, Feb 2026).
- Gold came from more than 40 lode mines in 12 states (USGS, Feb 2026).
- The top 25 operations yielded about 94% of U.S. mined gold (USGS, Feb 2026).
- About 7% of U.S. gold was a byproduct of processing base-metal ores, mostly copper (USGS, Feb 2026).
- U.S. mine output was 232 tonnes in 2016, so production has fallen by about a third in nine years (USGS, Jan 2021).
- U.S. gold mines and mills employed about 13,000 people in 2025 (USGS, Feb 2026).
- The country imported 320 tonnes of gold for consumption in 2025 and exported 260 tonnes (USGS, Feb 2026).
- About 16 U.S. refineries produced commercial-grade gold (USGS, Feb 2026).
How much gold is recycled?
Recycling supplied 1,404 tonnes in 2025, up 3% in a year when the dollar gold price rose 67% (World Gold Council, Jan 2026).
- Recycled supply fell 8% to 314 tonnes in the third quarter of 2026, the lowest quarterly total since late 2023 (World Gold Council, Nov 2026).
- U.S. refiners recycled an estimated 90 tonnes of new and old scrap in 2025, equal to about 60% of reported U.S. consumption (USGS, Feb 2026).
Who owns the most gold?
The United States holds more gold than Germany and Italy combined, and almost all of it sits in three Mint vaults. The buying today comes from elsewhere, with China and Poland leading reported purchases last quarter.
How much gold does the US have?
The Treasury's year-end gold stock has been about 8,130 tonnes in every year from 2021 through 2025 (USGS, Feb 2026).
- West Point, New York, holds 54,067,331 fine troy ounces in deep storage (U.S. Treasury, Oct 2026).
- The Denver Mint holds 43,853,707 ounces in deep storage (U.S. Treasury, Oct 2026).
- The Federal Reserve Bank of New York's vault holds 13,376,988 ounces of Treasury-owned bullion (U.S. Treasury, Oct 2026).
- The Mint's working stock of coins and blanks adds 2,783,219 ounces (U.S. Treasury, Oct 2026).
- The book value of the whole reserve is about $11.04 billion at the statutory price (U.S. Treasury, Oct 2026).
- The Federal Reserve does not own gold. The Gold Reserve Act of 1934 moved its gold to the Treasury, and the Fed holds gold certificates that cannot be redeemed for metal (Federal Reserve Board, Nov 2024).
Which countries hold the most gold?
Germany's Bundesbank counted 3,378 tonnes when it finished moving gold home from Paris and New York in 2017 (Deutsche Bundesbank, Aug 2017).
- It kept 1,710 tonnes, or 50.6%, in Frankfurt, with 1,236 tonnes at the New York Fed and 432 tonnes at the Bank of England (Deutsche Bundesbank, Aug 2017).
- Italy's reserve is 2,452 tonnes, held mostly as 95,493 bars (Banca d'Italia, Nov 2026).
- The Banca d'Italia describes Italy as the world's fourth-largest holder of official gold (Banca d'Italia, Oct 2026).
- The International Monetary Fund holds 90.5 million ounces, or 2,814.1 metric tons (IMF, Sep 2022).
- The IMF sold 12.97 million ounces, about one-eighth of its holdings, between October 2009 and December 2010 (IMF, Sep 2022).
Where is the world's gold stored?
Thousands of tons of official gold sit in one basement in Manhattan.
- None of the gold in the New York Fed's vault belongs to the New York Fed or the Federal Reserve System (Federal Reserve Bank of New York, Nov 2026).
- Holdings there peaked in 1973 at over 12,000 tons (Federal Reserve Bank of New York, Nov 2026).
- The vault rests on bedrock 80 feet below street level (Federal Reserve Bank of New York, Nov 2026).
- It has 122 compartments, and each one holds a single account holder's gold (Federal Reserve Bank of New York, Nov 2026).
- A 90-ton steel cylinder guards the only entrance (Federal Reserve Bank of New York, Nov 2026).
- The New York Fed charges a handling fee when gold moves but no storage fee (Federal Reserve Bank of New York, Nov 2026).
Which central banks are buying gold?
Central banks added a net 321 tonnes in the third quarter of 2026, against a five-year quarterly average of 227 tonnes (World Gold Council, Nov 2026).
- Purchases through the first nine months of 2026 reached 675 tonnes, 6% more than in the same period of 2025 (World Gold Council, Nov 2026).
- The People's Bank of China added 63 tonnes in the quarter and the National Bank of Poland added 40 tonnes (World Gold Council, Nov 2026).
- Those two banks made up about 86% of reported net purchases (World Gold Council, Nov 2026).
- Unreported buying accounted for around 63% of the quarter's central bank demand (World Gold Council, Nov 2026).
- Russia's 19-tonne decline was the only sizeable reduction any central bank reported (World Gold Council, Nov 2026).
What is the highest gold price ever?
For most of U.S. history the government set gold's price and rarely changed it. The market has set it since 1968, and the 2026 record sits more than six times above the famous 1980 peak.
What was gold's all-time high?
The record came in January 2026, after a year in which the LBMA afternoon price set 53 new all-time highs (World Gold Council, Jan 2026).
- Gold's quarterly average price peaked at US$4,873 an ounce in the first quarter of 2026 (World Gold Council, Apr 2026).
- The highest monthly average on record is $5,020 an ounce, set in February 2026 (MeltValue.com, Oct 2026).
- The price averaged US$4,262 an ounce in the third quarter of 2026 (World Gold Council, Nov 2026).
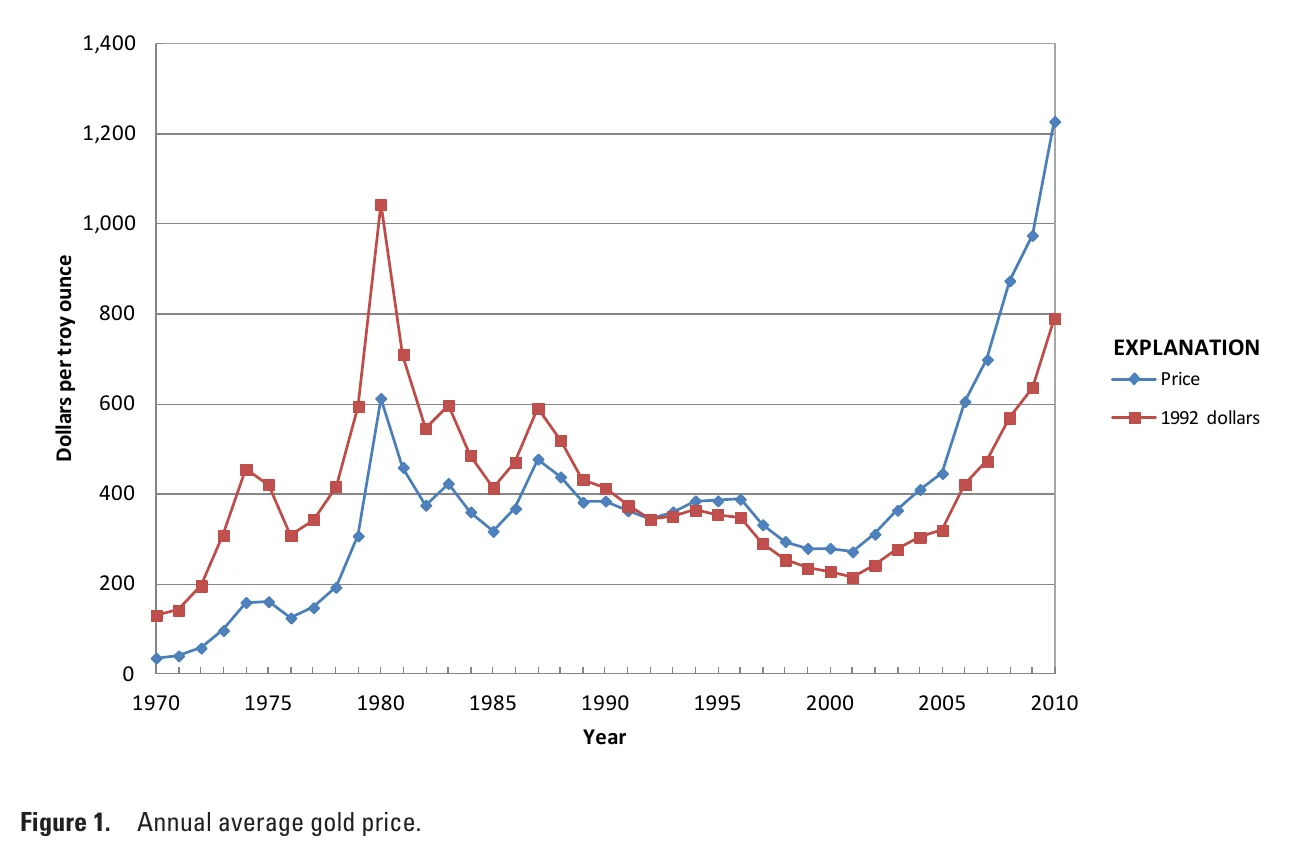
- Before this cycle, the best-known peak was a daily high of $850 an ounce on January 21, 1980 (USGS, Mar 2013).
What has gold cost by year?
Annual averages smooth out the spikes and show the long climb.
- Gold averaged $36 an ounce in 1970 and $608 in 1980 (World Bank, Sep 2026).
- It averaged $1,569 in 2011 and $1,770 in 2020 (World Bank, Sep 2026).
- The 2024 average was $2,388 (World Bank, Sep 2026).
- USGS estimates the 2025 average at $3,300 an ounce, up 38% and a record annual price (USGS, Feb 2026).
- On the LBMA benchmark, 2025 averaged US$3,431 an ounce, up 44% (World Gold Council, Jan 2026).
- The 1980 annual average of $612.56 was not beaten until 2007, when gold averaged $698.95 (USGS, Mar 2013).
What did gold cost 10 years ago?
Gold averaged $1,249 an ounce in 2016 (World Bank, Sep 2026).
- USGS, which uses a different price series, recorded a 2016 average of $1,252 (USGS, Jan 2021).
- The monthly average rose from $1,327 in September 2016 to $4,319 in September 2026 (MeltValue.com, Oct 2026).
When did the US stop fixing the price of gold?
The official price still exists on paper, but it stopped governing the market between 1968 and 1973.
- Gold was held at the equivalent of $20.67 an ounce for more than 200 years, until the Gold Reserve Act raised it to $35 on January 30, 1934 (USGS, Mar 2013).
- In March 1968 central banks stopped trading gold in the private market, which created an official price and a floating market price (USGS, Mar 2013).
- The United States suspended the conversion of dollars into gold on August 15, 1971 (USGS, Mar 2013).
- The official price rose to $38 on May 8, 1972, and to $42.22 on October 18, 1973 (USGS, Mar 2013).
- The ban on private gold ownership in the United States was repealed effective December 31, 1974 (USGS, Mar 2013).
Who buys gold?
Investors now set the pace. Jewelry has long been the largest single use, and its shoppers are spending more money on less metal.
What is gold used for?
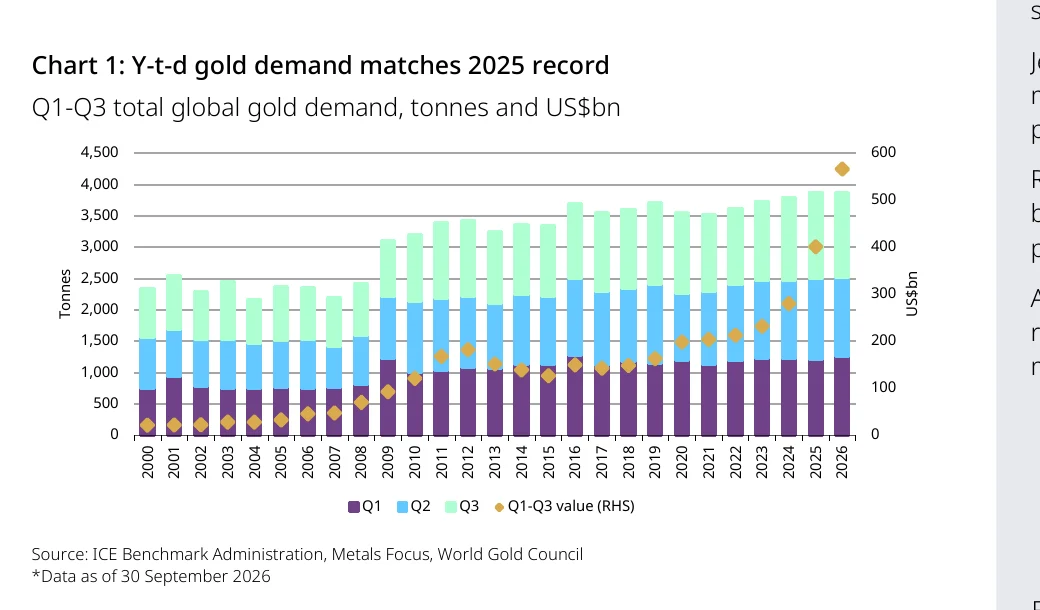
Jewelry takes about 40% of gold consumption, bars 24%, central banks 21%, coins and medals 7%, electronics 7% and other uses 1%, leaving out exchange-traded funds (USGS, Feb 2026).
- Total gold demand was 1,369 tonnes in the third quarter of 2026, 1% lower than a year earlier (World Gold Council, Nov 2026).
- Demand for the first nine months of 2026 was 3,881 tonnes, with a record value of US$566 billion (World Gold Council, Nov 2026).
- Technology used 85 tonnes in the quarter, the most since late 2021, helped by AI-related electronics (World Gold Council, Nov 2026).
How much gold jewelry do people buy?
The value of jewelry demand reached a record US$172 billion in 2025 even as the weight sold fell (World Gold Council, Jan 2026).
- Jewelry consumption has fallen year over year for 13 straight quarters (World Gold Council, Nov 2026).
- In the first nine months of 2026 jewelry volume fell 19% to 889 tonnes while spending rose 15% to almost US$130 billion (World Gold Council, Nov 2026).
- Chinese jewelry consumption fell 22% to 66 tonnes in the third quarter, the weakest third quarter there since 2006 (World Gold Council, Nov 2026).
How much gold do investors buy?
Gold-backed funds held a record 4,256 tonnes at the end of September 2026 (World Gold Council, Nov 2026).
- Those funds took in 211 tonnes in the third quarter, worth a record US$31 billion (World Gold Council, Nov 2026).
- Fund holdings grew by 801 tonnes in 2025, the second-strongest year on record (World Gold Council, Jan 2026).
- Bar and coin demand fell 19% to 268 tonnes in the third quarter of 2026 (World Gold Council, Nov 2026).
- Two quarters earlier, bar and coin buying of 474 tonnes was the second-highest quarter on record (World Gold Council, Apr 2026).
- For scale, all gold funds together held 2,190 metric tons at the end of 2010 (USGS, Mar 2013).
How many gold coins does the US Mint sell?
The Mint forecasts bullion demand of 29.5 million ounces in each of fiscal 2026 and 2027, about double what it sold in fiscal 2025 (U.S. Mint, Apr 2026).
- The 2025 American Liberty one-ounce 24-karat gold coin brought in $36.8 million in revenue (U.S. Mint, Apr 2026).
- Federal law sets the $50 gold coin at 33.931 grams containing one troy ounce of fine gold (U.S. Code, Nov 2026).
- The $25 gold coin weighs 16.966 grams and contains half a troy ounce (U.S. Code, Nov 2026).
What is scrap gold worth?
Melt value is the floor under every piece of gold you own. Ten years of price gains have raised that floor a long way, and the jewelry in a drawer has risen with it.
What is gold worth per gram by karat?
Pure 24K gold averaged $138.72 a gram in September 2026 (MeltValue.com, Oct 2026).
- At the same price, 18K gold averaged $104.14 a gram and 10K gold $57.86 (MeltValue.com, Oct 2026).
- In January 2000 a gram of 14K gold was worth $5.33 (MeltValue.com, Oct 2026).
- Under the FTC's Jewelry Guides, the word "gold" with no karat mark may only describe 24-karat metal, and any alloy must state its karat fineness (Federal Trade Commission, Nov 2026).
What are US gold coins worth melted?
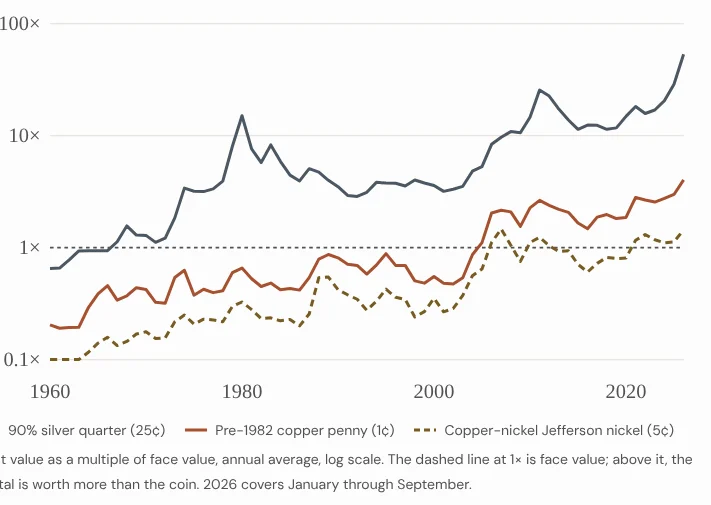
A $20 double eagle held $4,178.63 of gold at September 2026 prices, about 209 times its face value (MeltValue.com, Oct 2026).
- A one-ounce American Gold Eagle, with a $50 face value, held about 86 times face value in gold (MeltValue.com, Oct 2026).
What are silver coins worth melted?
The silver in a pre-1965 quarter was worth $11.68 in September 2026, about 47 times face value (MeltValue.com, Oct 2026).
- That quarter's melt value first passed 25 cents in July 1967 and has stayed above it every month since January 1972 (MeltValue.com, Oct 2026).
- A Morgan silver dollar held $49.96 of silver in September 2026 (MeltValue.com, Oct 2026).
- A pre-1982 copper cent held 4.34 cents of metal (MeltValue.com, Oct 2026).
- Silver averaged $39.80 an ounce in 2025 (World Bank, Sep 2026).
- World silver mines produced 846.6 million ounces in 2025, up 3% (Silver Institute, Apr 2026).
- The law requires a one-ounce American Silver Eagle to weigh 31.103 grams of .999 fine silver (U.S. Code, Nov 2026).
How is selling gold taxed?
- The IRS taxes net capital gains from selling collectibles, a category that includes coins, at a maximum rate of 28% (IRS, Nov 2026).
To price your own pieces at today's spot price, use the gold calculator or the US gold coin melt values table. Melt value counts metal only. A dealer's offer is usually lower.
Glossary
- Troy ounce: the unit gold trades in. One troy ounce is 31.1035 grams.
- Tonne: a metric ton, or 1,000 kilograms. One tonne is 32,150.7 troy ounces.
- Karat: gold purity out of 24 parts. 14K is 58.3% gold and 18K is 75%.
- Melt value: what the metal in an item is worth at the market price, before any dealer margin.
- LBMA Gold Price PM: the afternoon benchmark price set in London each trading day.
- ETF: exchange-traded fund. A gold-backed ETF holds bullion on behalf of its shareholders.
- Reserves and resources: reserves are deposits that can be mined at a profit today. Resources include deposits that cannot yet.
- Statutory price: the $42.2222 an ounce at which the Treasury books its gold.
Methodology and Sources
We used figures only from the body that produced them: government agencies, central banks, the World Gold Council and the World Bank. We read each source page or file in November 2026 and checked every number against it. Where two sources measure the same thing differently, such as mine production from USGS and the World Gold Council, we give both and name each. The World Gold Council's stock page gives a headline of about 222,600 tonnes mined through history beside a table total of 224,200 tonnes, and we use the table. Pages with no printed date (New York Fed, U.S. Code, FTC guides, Banca d'Italia) carry the month we read them. MeltValue.com figures come from our open dataset, which is built from World Bank monthly average prices. We refresh this page monthly.
Sources
- World Gold Council, Above-ground stock
- World Gold Council, Gold Demand Trends Q3 2026 press release
- World Gold Council, Gold Demand Trends Q3 2026 executive summary
- World Gold Council, Q3 2026 central banks
- World Gold Council, Q3 2026 jewellery
- World Gold Council, Q3 2026 supply
- World Gold Council, Q3 2026 investment
- World Gold Council, Gold Demand Trends Q4 and Full Year 2025
- World Gold Council, Gold Demand Trends Q1 2026
- World Gold Council, Are we running out of gold?
- World Gold Council, Gold production by country
- U.S. Geological Survey, Mineral Commodity Summaries 2026: Gold
- U.S. Geological Survey, Mineral Commodity Summaries 2021: Gold
- U.S. Geological Survey, Metal Prices in the United States Through 2010
- U.S. Treasury, U.S. Treasury-Owned Gold
- Federal Reserve Bank of New York, Gold Vault
- Federal Reserve Board, Does the Federal Reserve own or hold gold?
- U.S. Mint, FY 2027 Congressional Budget Justification
- U.S. Code, 31 U.S.C. 5112
- Federal Trade Commission, Jewelry Guides, 16 CFR 23.3
- IRS, Topic no. 409, Capital gains and losses
- World Bank, Commodity Price Data (The Pink Sheet)
- MeltValue.com, US Coin Melt Value History, 1960 to 2026
- Deutsche Bundesbank, Bundesbank completes gold transfer ahead of schedule
- Banca d'Italia, Riserve in oro
- Banca d'Italia, Gold between Continuity and Change
- IMF, Gold in the IMF
- NOAA, Is there gold in the ocean?
- Silver Institute, World Silver Survey 2026 release